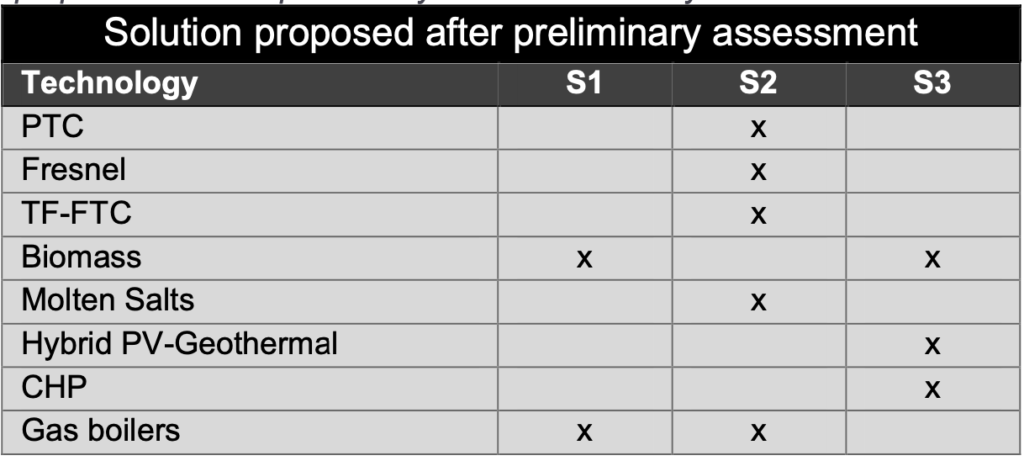
Żyrardów (Żyrardów, Poland)

Table of Contents

Context

Żyrardów is a town in central Poland with approximately 41,400 inhabitants. The town was developed during the 19th century into a significant textile mill town in Poland.

The District Heating system covers around half of the city and is still developing. There are no renewable energy systems in Żyrardów DH. The management is considering retrofitting the power plant using biomass and gas, and removing the coal fired boilers. They are also considering the cogeneration and geothermal systems for the DH. Cooling technologies are not considered since there is no cooling demand.

Solar installations as fresnel, parabolic trough collectors and low concentration flat collectors might encounter limitations, such as low irradiation, lack of space and high costs. Therefore, these renewable sources are not considered. However, an energy-economic analysis should be done in order to find the most suitable solution in a hypothetical retrofitting solution.

Poland has established an objective of 21% of renewable energy on the final energy consumption by 2030. This aims at achieving a more sustainable energy sector in Poland. Moreover, 70% of all households in Poland are to be connected to DH networks by 2030, as DH is considered to be one of the best solutions to increase the share of renewable energy in the heating sector. Right now the heat production is dominated by the fossil fuels.

Gross heat production by fuel and year in Poland

Regarding the installed heating capacity, the individual boilers represent a 64% of the total power, followed by the 25% of DHs with boilers (mainly based on fossil fuels) and 10% of DHs with CHP.

Installed heating capacity installed in Poland in 2015

Area

There are two thermal plants in Żyrardów: One hard coal fired with water boilers (around 63 MW in fuel) and one 10 MW gas fired boiler, located around 2 km from the main heat plant.

In the map below the area in red circle is the 63 MW power plant driven by coal boilers. The blue circle represents the location of the smaller 10 MW power plant. The district heating system supplies energy in all the green marked area.

Żyrardów District Heating map

The DH network has a length of around 43 km. In 2013-2016 almost all sections of DH made in “traditional technology” were replaced by pre-insulated pipes (currently 99,9% of the network is made in pre-insulated technology). The energy losses in the network represent around 13- 14% of the produced energy. The DH was also expanded by so called ”rings”, which considerably reduced the electric energy consumption.

Żyrardów District Heating installation

Energy Demand and Supply

Produced Thermal Energy

The supply temperature varies seasonally depending on the outdoor temperature. In winter it can reach almost 122C when the outdoor temperature is -20C while in summer the temperature is quite constant around 70C.
The return temperature is between 60-70C during the winter, and 45-55C during the summer.

DH supply temperature
DH return temperature

The yearly curves of the produced thermal energy are as follows:

Produced thermal energy

The peak demand is in winter. In summer the produced thermal energy covers the domestic hot water (DHW) demand, which is quite constant over the years. The table below represents the heat production from 2011-2020 also for gas heating station in 2014-2020.

Produced thermal energy

Throughout the years, the thermal energy production by the gas station, has been stable (around 54,000 GJ) and represented a 14% of the total amount. When the gas boiler is operating, the daily produced energy is quite constant, between 350 and 400 GJ, which is the energy that the 10 MW gas boiler produces in 12 hours period working at full capacity.

In summer there are usually 2-4 weeks, when the coal boilers are switched off and the gas boiler is switched on to produce thermal energy for DHW. The capacity of the gas boiler completely covers this demand of energy during the summer. These 2-4 weeks period are used for maintenance work at main heat plant.

Heat power

The monotonous load curves that appear below are not very precise, since the data that was gathered is a daily average heat power, so the hourly peaks are not registered here.
It has been possible to have access to hourly data for some days and we have seen that between the daily average value and the peak power there could be a difference of 10% to 30%. Therefore, 46 MW peak power could be “converted” into almost 60 MW, which is more realistic when compared it with the installed power. Recently (February 2021), which is not shown in the graph, the peak demand exceeded 50 MW due to longer periods of outdoor temperature below -10 C. Thus, it might be assumed that for longer periods with temperature below -20C, 60 MW peak might be reached once per 10 year for instance.

Monotonous load curve

Proposed technologies

Considering the previous information, the technologies and solutions proposed for studying in Żyrardów are the following:

Solar technologies

Integration of solar panels in the central stations to cover extra heating load
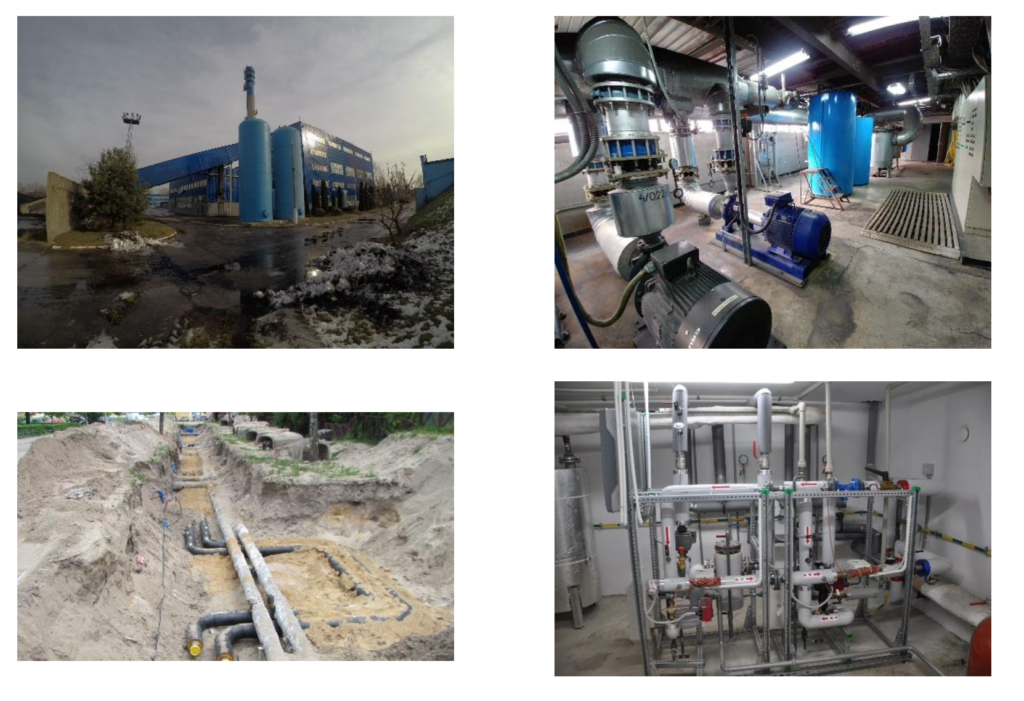
Biomass boiler

Biomass boilers installation for replacing partially or totally the existing fossil fuel fired boilers

Optimised water and molten salt storage

for acting as solar buffer and to maximise the biomass boiler energy production

Geothermal heat pumps as a renewable energy source

The PV installation coupled with these HPs will be analysed

CHP

Three 1 MWe gas engines (3 x 2.5 MW in fuel) located in different places in Żyrardów.

Gas boilers installation

to cover peaks from November to March

Proposed solutions

The combination of the different technologies generates three main solutions which will be studied in the next steps (other solutions might arise during the activity):

Solutions proposed after the preliminary assessment for Żyrardów demo-follower

Solution 1

This combination integrates biomass boilers and the installation of new gas boilers to cover the heating peak demands.

Expected Impact

Increase at 90% the thermal production by renewable energies

Maximise biomass boiler energy production

Evaluate tech-economic feasibility of the proposed solutions

Evaluate availability of biomass

Analyse the biomass sector in Poland

Solution 2

This combination integrates solar technologies and thermal storage systems based on hot water and molten salts. Besides, the existing coal fired boilers are replaced by gas boilers.

Expected Impact

Increase at 30% the thermal production by renewable energies

Increase energy efficiency of current installation

Evaluate tech-economic feasibility of the proposed solutions

Evaluate space requirements for the solar panels

Evaluate the optimised combination of the chosen technologies

Solution 3

This combination integrates biomass boilers, geothermal heat pump system (coupled with PV system) and CHP.

Expected Impact

Increase at 90% the thermal production by renewable energies

Maximise geothermal heat pump system for DHW in summer

Evaluate tech-economic feasibility of the proposed solutions

Evaluate the operation strategy modes

More information on the simulation activities will be posted in the future.